Author: Bill White
Source: Real Capital Analytics
Original Article: https://www.rcanalytics.com/distress-cycle-looks-like/
In February this year we knew we were late stage in a commercial real estate cycle and by April the only thing for certain was that we were very early into a new cycle. Over the past decade the U.S. enjoyed a prolonged expansionary cycle and there is a generation of new commercial real estate professionals that have never experienced a down cycle. For the rest of us, there is still a lot to learn from the last distress cycle that will inform what the upcoming one will look like.
A distress cycle depends on one’s perspective, and to many investors it looks like opportunity. Some of the largest real estate fortunes have been made during down cycles. Sam Zell is perhaps best known, but many of the major real estate equity funds got their start as vulture/opportunistic investors. Going into this down cycle, there is far more capital on the sidelines looking for deals and this excess of dry powder should serve to shorten the cycle and help blunt the price correction.

Cycles are usually defined by duration and magnitude. Let’s first take magnitude. In the last cycle, Real Capital Analytics tracked over $462 billion of troubled commercial real estate, which is roughly equal to the peak trading volume in the year leading up to it, or about 12.5% of outstanding commercial mortgages at the time. Property prices tumbled 35% nationally, causing equity to be wiped out in many deals. Lenders realized significant losses as well, recouping just 67% of defaulted mortgage balances.
The magnitude of distress was not uniform then, nor will it be this time. The hotel, retail and senior housing sectors will clearly have more trouble resulting from Covid-19. Geographically, housing-driven markets suffered most in the last cycle, while this time it is likely to be those dense cities most directly impacted by the pandemic or those dependent on the energy industry.
Among lenders, the largest losses last cycle were suffered in the CMBS sector which was then the predominant source of debt capital. Recently, CMBS has only been a modest part of the debt markets. Instead, non-traditional lenders, who have aggressively grown market share in recent years, may be an area of greater concern.
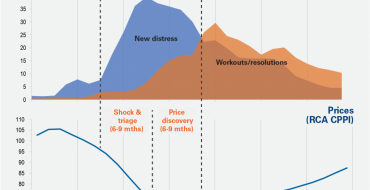
In the prior cycle, distress and work-outs dominated the commercial property markets for over three years and it took six years for property prices to recover. Every cycle is different and certainly the origins of the prior cycle’s demise and the current one could not be more different. However, both started suddenly with a trigger event — the fall of Lehman Brothers in September 2008 and the Covid-19 pandemic in March 2020 — and will unfold in similar ways.
First there is the Ramp-upstage where distress inflows exceed outflows and lenders must triage trouble situations and bulk up on work-out capacity. This stage averaged 18-24 months last cycle and was followed by a Work-outperiod lasting two to three years, or even longer in select markets. The divider between the Ramp-up and Work-outstages is the inflection point where investment trends collectively turn positive again.

The Ramp-up stage can be brief, often less than 18 months, and also has two phases. The Shock & Triage phase comes after the initial economic dislocation and some lenders are overwhelmed by a wave of distress. These lenders then simultaneously halt or slow new originations causing a scarcity of credit. Transaction volumes plummet and references to “catching a falling knife” are heard frequently.
As transactions begin to trickle through and the first distressed sales occur at the end of the Shock & Triage phase, new price expectations start to form in the Price Discovery phase. This narrow window of opportunity is when investors typically score the best deals and achieve the highest returns.
After the frenzied Ramp-upperiod, the Work-outstage plays out at a much more measured pace. In the last cycle it lasted for years. The “pretend and extend” strategy — basically just a loan modification — turned out well for lenders and borrowers alike then, and will likely be the preferred work-out strategy this cycle. This will again frustrate the vulture/opportunistic investors who expected to feast on more distressed assets. Still, for almost two years distressed sales accounted for 15-20% of sales volume and ranged much higher for certain property types and markets.
There is no clear ending to the Work-outstage as it transitions into recovery and expansion. During the last cycle it took Las Vegas five years to resolve, but San Francisco and New York City less than two years. RCA’s tracking of the last cycle shows that a market needs to have resolved the majority of its distress before a recovery can start, a metric that RCA will be watching closely this cycle.
Drawing on our experience and unique data from the last distress cycle, RCA will be able to identify key inflection points as this distress cycle moves through its stages and eventually into recovery. We will be publishing a series of articles over the coming weeks and months that we trust will be just as valuable to those experiencing a down cycle for the first time as for those who have a number of cycles under their belt.
RCA will also be providing online training sessions for clients to teach them how to access information on watchlist and defaulted loans, stalled construction projects and other troubled assets. In summary, RCA is committed to providing our clients with the data and insights necessary to mitigate losses and seize opportunities for the new cycle ahead.